The Art of Logging
2/28/2023
Understanding logging is not an easy task. Developers often struggle with whether logging at certain points is meaningful, SREs are often helpless when facing production issues without logs, Ops need to spend more effort maintaining massive logs, and project managers often don't want to spend too much resources managing logs that have no actual business value.
Therefore, following good practices when developing applications and choosing mature solutions when collecting and managing logs can often alleviate these contradictions. This is what this article is about.
The Beginning of Contradictions
First, let's talk about why we need to record logs and their purpose. Actually, there's no need to introduce too much about the role of logs, because most developers have clear feelings and strong needs when debugging code problems and solving bugs in different environments. Logs serve as debugging assistants and lifesavers in production environments. I've only seen developers and ops personnel complaining about too few logs, but almost never seen anyone complaining about too many logs. By querying logs to determine code branch direction, whether APIs are requested correctly, whether core business data is correct, and whether there are error stack traces, these all constitute the primary means for developers and ops personnel to judge code and production problems. It's hard to imagine how to troubleshoot production bugs if a complex and large system doesn't record any logs.
If there's such a strong need, why not log every line of code to record context? This way, no matter what environment has what code problems, they can all be troubleshot by searching logs. Theoretically, this is feasible, but there are some problems that currently cannot be solved. First is the log storage issue. Common medium and large systems have logs at TB level, and super large systems have logs at PB level. According to data provided by Cloudflare, it processes about 40 million requests per second, which is a huge challenge for storage costs. Second is the decline in search performance. Common log storage solutions like Elasticsearch databases will cause explosive growth in the mapping relationships they maintain with massive logs. Even if different indexes are divided and different ElasticSearch clusters are managed distributedly, it's difficult to prevent search performance from declining as data volume increases. Third is that massive log generation will slow down system performance during peak periods and increase the risk of failures.
So we can draw the simplest conclusion: logs should neither be printed too much, making log storage and management too difficult, nor should they be printed too little, making it impossible for ops personnel to troubleshoot problems. This sounds contradictory, but this is the art of logging!
Log Levels
Usually, before we plan to record logs, we need to determine the log level. Before introducing how to determine log levels, let's talk about the role of log levels. First, as everyone knows, log levels can help determine the priority of log information and effectively reduce information noise and alert fatigue. Second, when querying logs, adding log level filtering can effectively query the needed logs.
Common log levels include the following categories, in order from low to high: TRACE, DEBUG, INFO, WARN, ERROR, FATAL. Usually in local environments, we configure the log level to Trace, which prints all levels of logs. But in production environments, due to storage pressure, query performance, and disk IO impact, the log level is adjusted to INFO level or even ERROR level. This means that logs below this level in your code will not be printed.
Does this mean we only need to print logs that match the production environment level in our code? For example, if the production environment only prints INFO level logs, we write DEBUG level logs in the code that won't be printed, so there's no need to write them. Some project managers, to save log management costs, only print ERROR level logs in production environments. Should INFO level logs also not be written? Only printing logs that match the production environment level in code is indeed the current situation I see in most projects, but reality is often more complex, as in the following scenarios.
Scenario 1
An engineer investigating a performance issue with a resource creation API in production found that the API wrote INFO level logs before saving resources, writing all resource objects to logs. Due to the many object attributes, this caused massive logs to be printed during business peak periods, exhausting buffer memory and slowing down the main thread, causing overall service performance degradation. Therefore, the engineer deleted this business log printing operation to reduce production environment disk IO consumption and solve the performance problem.
But one day, due to modifications to a service in the API service call chain, the objects created by the API had errors. Due to the lack of logs when saving resources in the production environment, it was impossible to troubleshoot whether the API request parameters were problematic or the subsequent calculation logic was problematic. Should we modify the log level and rebuild and deploy online at this time?
Scenario 2
Suppose the production environment log is set to ERROR level. At some point, the dependent downstream service fails, causing a large number of request timeouts. Due to the very high QPS during business peak periods, a large number of error logs are generated in a short time, causing disk IO to increase sharply, consuming a lot of CPU, and causing the entire service to crash. How should we handle this?
Scenario 3
When an engineer is troubleshooting production problems, they find that INFO level logs cannot satisfy troubleshooting the root cause. There's a DEBUG level log they need, but the production environment only has INFO level. Should they modify the level and restart the service at this time?
Log Level Standards and Dynamic Adjustment
The solution to the above problems is: first, we need to clarify log level standards in projects and not use log levels arbitrarily for debugging convenience or storage reduction. Second, add dynamic adjustment functionality to log levels. This means when solving online problems, lower the online log output level to get comprehensive debug logs, helping engineers improve problem location efficiency. When production logs increase massively and slow down service performance, raise the online log output level to reduce log generation, alleviate disk IO pressure, and improve service performance.
Here are suggestions for log levels:
-
TRACE: Should be used during development to trace errors, but never committed to version control systems (VCS).
-
DEBUG: Record anything that happens in the program. Mainly used during debugging. It's recommended to reduce debug statements before entering production, keeping only the most meaningful entries that can be activated during troubleshooting.
-
INFO: Record all user-driven events or system-specific operations (such as periodic scheduled operations).
-
WARN: This level records all events that might become errors. For example, if a database call takes longer than predefined time, or if memory cache approaches capacity. This allows appropriate automatic alerts and better understanding of system behavior before failures during troubleshooting.
-
ERROR: Record every error condition at this level. This can be API calls returning errors or internal error conditions.
-
FATAL: Represents that the entire service can no longer work. Use this level very sparingly. Usually this level records indicate program termination.
Recording Logs
When to Record Logs
When to record logs has no standard specification. Developers need to judge based on business and code. Besides regular event recording, such as what operations were performed, unexpected situations, unhandled exceptions or warnings during runtime, and regularly executed automatic tasks, I also suggest adding logs in the following scenarios:
- When calling third-party systems, record the API URL with
Request/Response Bodyand exceptions to logs. The reason is that when failures occur, there can be clear and explicit log reports explaining failure causes, reducing responsibility determination between different system service ops personnel or different companies, promoting smoother problem resolution. - Add logs to important core business key code and branches, such as if-then-else statements. This can help developers understand whether the program traversed expected paths based on its current state. Since core business data is generally difficult to reproduce manually, understanding code branch direction is crucial.
- Core business audit logs. If a business is related to legal or contractual matters, adding audit logs to corresponding operations is very necessary. Log storage requires strong consistency databases.
- Output configuration information when application services start. Initialization configuration logic generally executes only once and is inconvenient to reproduce during diagnosis, so it should be output to logs.
Log Attributes
Besides regular log printing needs like log level, timestamp, message, exception, and stack trace, troubleshooting often requires other fields to help locate and find root causes. Common additional fields include:
trace id: The unique ID for service chain tracing. When requests enter the system's 7-layer gateway, add the uniquetrace idfor the entire request lifecycle in HTTP headers and carry it throughout the request call. When request chains are too long and developers have difficulty finding complete request logs,trace idhelps reverse lookup complete logs.span id: Represents individual operations split within thetrace idlifecycle. For example, when requests reach each service, services generate spanid for requests. The first spanid is called root span, while spanid passed from upstream with requests is recorded as pspanid (parent-spanid). When the current service's generated spanid is passed to downstream services with requests, this spanid becomes pspanid recorded by downstream services. Thusspan idhelps restore the entire request call chain view when service calls are complex.user id: The user's unique ID. Ensures that when users report issues or submit tickets, corresponding error logs can be directly queried based on the current user's unique ID, reducing interference and shortening troubleshooting cycles.tenant_id: This is the tenant ID (if it exists). Very helpful for multi-tenant systems.request uri: The current microservice request URI (one user business operation may correspond to differentrequest uriof multiple services). When a business has problems, getting thetrace idthrough the entryrequest uricorresponding to that business can often quickly find corresponding request logs and solve problems.application name: The current microservice name. Helps identify which service generated this log and helps filter logs byapplication nameto query overall service failures.pod name: The k8s resource Pod name where the current request is located (if it exists). Most microservices currently use k8s for container orchestration. Printingpod namehelps restart or kill pods when certain pods fail.host name: The machine name where the current request is located. Even when using k8s to host microservices, there can be situations where services cannot work normally due to disk or network failures on certain machines where k8s clusters are located. Printinghost namehelps troubleshoot the last mile, i.e., failures due to machine hardware problems.
Log Security
Logs need to ensure log framework security and sensitive information handling. Framework security refers to using mature, extensively production-verified log framework libraries rather than reinventing the wheel. Sensitive information handling is the lifeline of most companies. Please remember log security and compliance requirements:
- Don't leak sensitive personally identifiable information (PII).
- Don't leak encryption keys or secrets.
- Ensure company privacy policies cover log data.
- Ensure log providers meet compliance requirements.
- Ensure data storage time requirements are met.
Log Bad Smells
- Using Chinese or non-English for printing logs.
- English means logs will be recorded in ASCII characters. This is particularly important because Chinese may not be correctly presented after a series of processing due to character sets or encoding sets.
- English has built-in word segmentation effects. When using storage engines like
ElasticSearchwith inverted indexes to store logs, Chinese logs not only need dedicated tokenizers but also have worse storage and query effects than English.
- Logs without context. Such as directly printing
Transaction failedorUser operation succeeds. Because when writing code, log messages can be understood through code context, but when reading logs themselves, this context doesn't exist, making these messages potentially incomprehensible. - Placing log printing operations in loops. Unless specifically needed, printed logs are not only difficult to read and find but also consume massive storage resources.
- Referencing slow operation data. If the current context doesn't have data needed for printing logs and requires calling remote services, getting from databases, or extensive calculations, consider first whether this information is necessary and appropriate to put in logs.
Log Observability
In the past decade, due to the successive rise of microservices and cloud native, the field of collecting, storing, and analyzing logs has undergone major changes. Early on, we didn't need log collection. At that time, all logs of monolithic services were stored in files, using tail, grep, awk to mine information from logs. But in today's increasingly complex systems, this approach can no longer meet our needs. To address increasingly complex log management needs, the open source community and industry have developed a series of solutions, such as the most popular Elastic Stack open source solution, and one-stop solutions provided by cloud vendors like AWS DataDog and Azure Dynatrace.
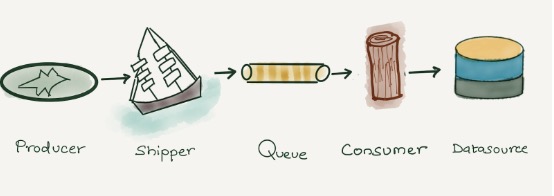
Regardless of which solution is used, log management is no longer a simple topic. Between our clear perception of printing logs and querying and analyzing logs, there are several steps including log collection, buffering, aggregation, processing, indexing, and storage, each containing difficulties and twists.
Log Collection
Initially, we used Logstash from Elastic Stack for log collection and processing. Different services in the system actively sent requests to push logs to Logstash using tcp/udp protocols, then Logstash transformed and processed logs (data structuring) and output them. This mode lasted for a long time, but it also had serious flaws: Logstash and its plugins were written in JRuby and had to run on separate Java virtual machine processes, with default heap size reaching 1GB. If thousands of log collectors needed deployment, this solution was too heavy. Later, Elastic.co rewrote a lighter, more efficient log collector Filebeat with fewer features using Golang to alleviate this contradiction.
Additionally, Fluentd is usually the preferred open source log collector when working with Kubernetes. It's Kubernetes native and can be deployed using DaemonSet for seamless Kubernetes integration. It allows collecting logs from different places like Kubernetes clusters, MySQL, Apache2, etc., and parsing and sending to required locations like Elasticsearch, Amazon S3, etc. Fluentd is written in Ruby and runs well under low volume, but also has performance issues when needing to increase the number of nodes and applications.
Finally, during log collection, there might be massive log generation during business peak periods, affecting service stability and causing log loss. In this situation, we need to add a buffer layer before Logstash or log storage databases. For smaller scale systems, Redis streams is a good choice. For larger scale data, Kafka clusters or message queue solutions provided by cloud vendors would be the best choice.
Structured Logging
After collecting logs, we need structured processing. Because logs are unstructured data, one log line usually contains multiple pieces of information. Without processing, logs can only be used in the original full-text search manner, which is neither conducive to statistical comparison nor conditional filtering. The following line is an Access Log from an Nginx server.
10.209.21.28 - - [04/Mar/2023:18:12:11 +0800] "GET /index.html HTTP/1.1" 200 1314 "https://guangzhengli.com" Mozilla/5.0 (Macintosh; Intel Mac OS X 10_15_7) AppleWebKit/537.36 (KHTML, like Gecko) Chrome/110.0.0.0 Safari/537.36Although we're used to the default Nginx format, the above example is still difficult to read and process. We can convert it to structured data through Logstash or other tools, such as JSON format.
{
  "RemoteIp": "10.209.21.28",
  "RemoteUser": null,
  "Datetime": "04/Mar/2023:10:49:21 +0800",
  "Method": "GET",
  "URL": "/index.html",
  "Protocol": "HTTP/1.1",
  "Status": 200,
  "Size": 1314,
  "Refer": "https://guangzhengli.com",
  "Agent": "Mozilla/5.0 (Macintosh; Intel Mac OS X 10_15_7) AppleWebKit/537.36 (KHTML, like Gecko) Chrome/110.0.0.0 Safari/537.36"
}
After structuring, databases like ElasticSearch with inverted indexes can build indexes for different data items and perform query statistics, aggregation, and other operations.
Additionally, there's an industrial practice like Splunk recommending converting fields to key-value pairs in the same large canonical log line (logfmt). Converting Nginx logs to canonical log lines would look like this:
remote-ip=10.209.21.28 remote-user=null datetime="04/Mar/2023:10:49:21 +0800" method=GET url=/index.html protocol=HTTP/1.1 status=200 size=1314 refer=https://guangzhengli.com agent="Mozilla/5.0 (Macintosh; Intel Mac OS X 10_15_7) AppleWebKit/537.36 (KHTML, like Gecko) Chrome/110.0.0.0 Safari/537.36"After storing this type of data in Splunk, it can be retrieved using built-in query language, such as using method=get status=500 to query all GET methods returning 500 responses. Using method=get status=500 earliest=-7d | timechart count query statement to get the total count and chart of GET methods returning 500 responses in the past 7 days. I haven't used this approach much, so those interested can refer to Stripe canonical-log-lines for more details.
Log Storage and Querying
After log data structuring, data can be stored in databases for query and analysis. Before choosing what solution to use for storage and analysis, let's look at the characteristics of log data.
- Logs are write-intensive, with over 99% of logs never being queried after writing.
- Logs are standard time-series data that need sequential writing and won't be modified after storage in databases.
- Logs have timeliness, generally only needing recent logs for query analysis or troubleshooting. After some time, they'll be cleared by retention policies or archived.
- Logs are semi-structured. Although we structure all application service logs, there are still system logs, network logs, etc., with different fields.
- Log queries depend on full-text search and ad-hoc search.
- Log queries don't require strong timeliness but can't accept delays of hours or even days.
Based on the above storage and query requirements, Elasticsearch dominates the log storage field. Elasticsearch can use time ranges as indexes. For example, if indexing daily based on actual data volume, since tomorrow's and the day after's dates can be accurately predicted, all indexes can be pre-created, eliminating the overhead of dynamic creation like finding nodes, creating shards, and broadcasting change information in clusters. Additionally, Elasticsearch can perform hot-cold data processing for data in different time ranges, configuring SSD and stronger processors for recent log data, and using HDD storage or AWS S3 for archiving older data.
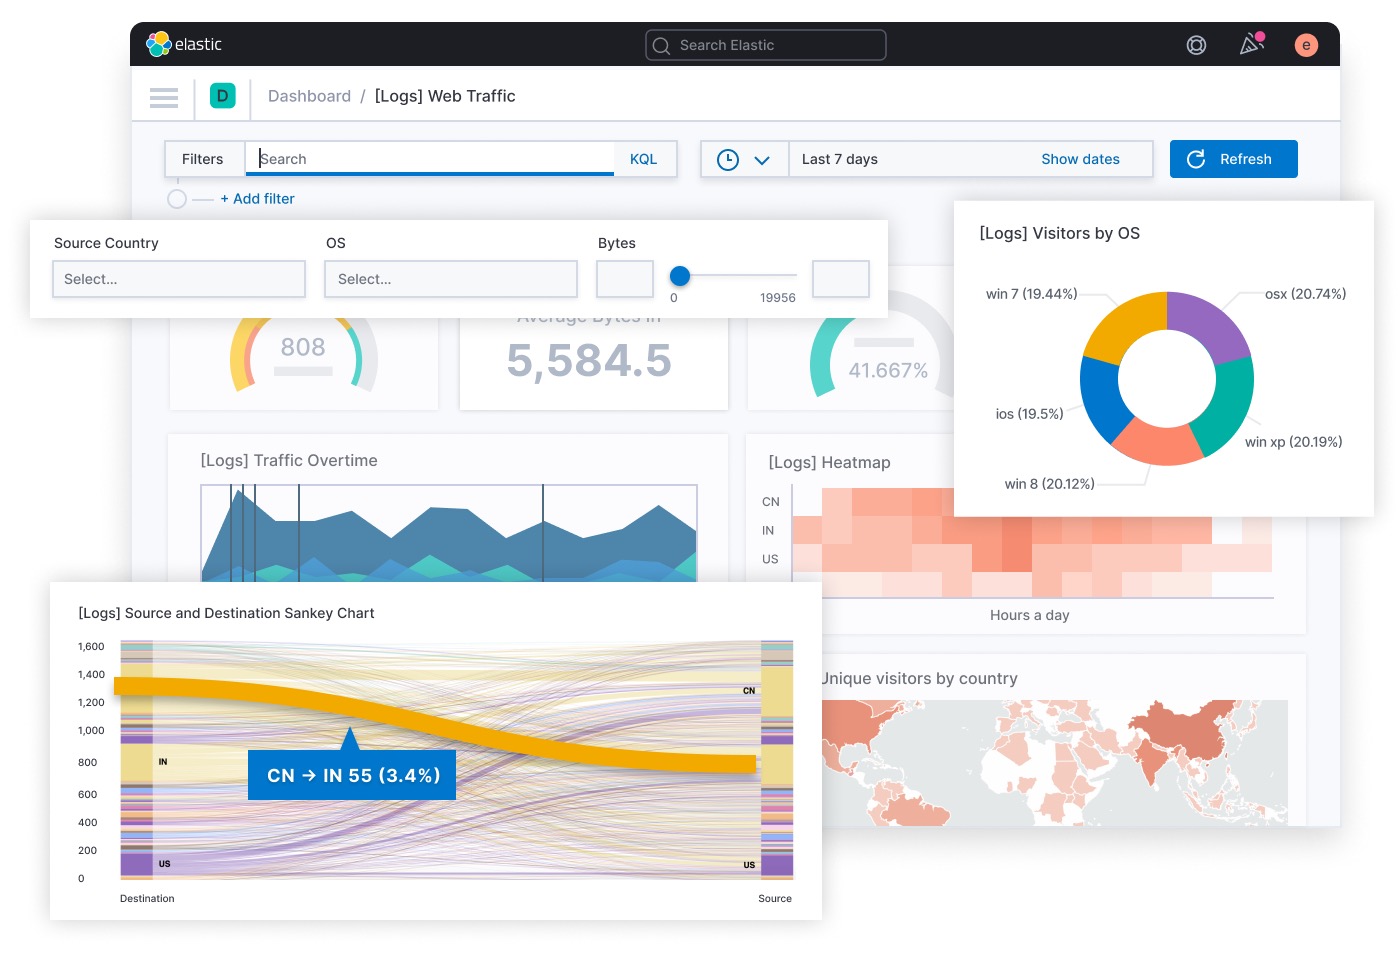
Most importantly, Elasticsearch's core storage engine uses inverted indexes naturally suited for full-text search, and its paired Kibana (only responsible for graphical interface and display) can perfectly adapt to data retrieval, aggregation, statistics, and customization to form various graphics and tables. The following image is from Elastic Stack official:
Of course, Elasticsearch isn't without flaws. Mapping Explosion is one of Elasticsearch's known defects. Elasticsearch maintains a mapping table of documents and fields. When this mapping table has too many keys, it occupies a lot of memory, causing frequent garbage collection. Its secondary hot-cold tiered storage also has defects. Elasticsearch moves data from hot to cold storage daily, which also affects cluster read-write performance.
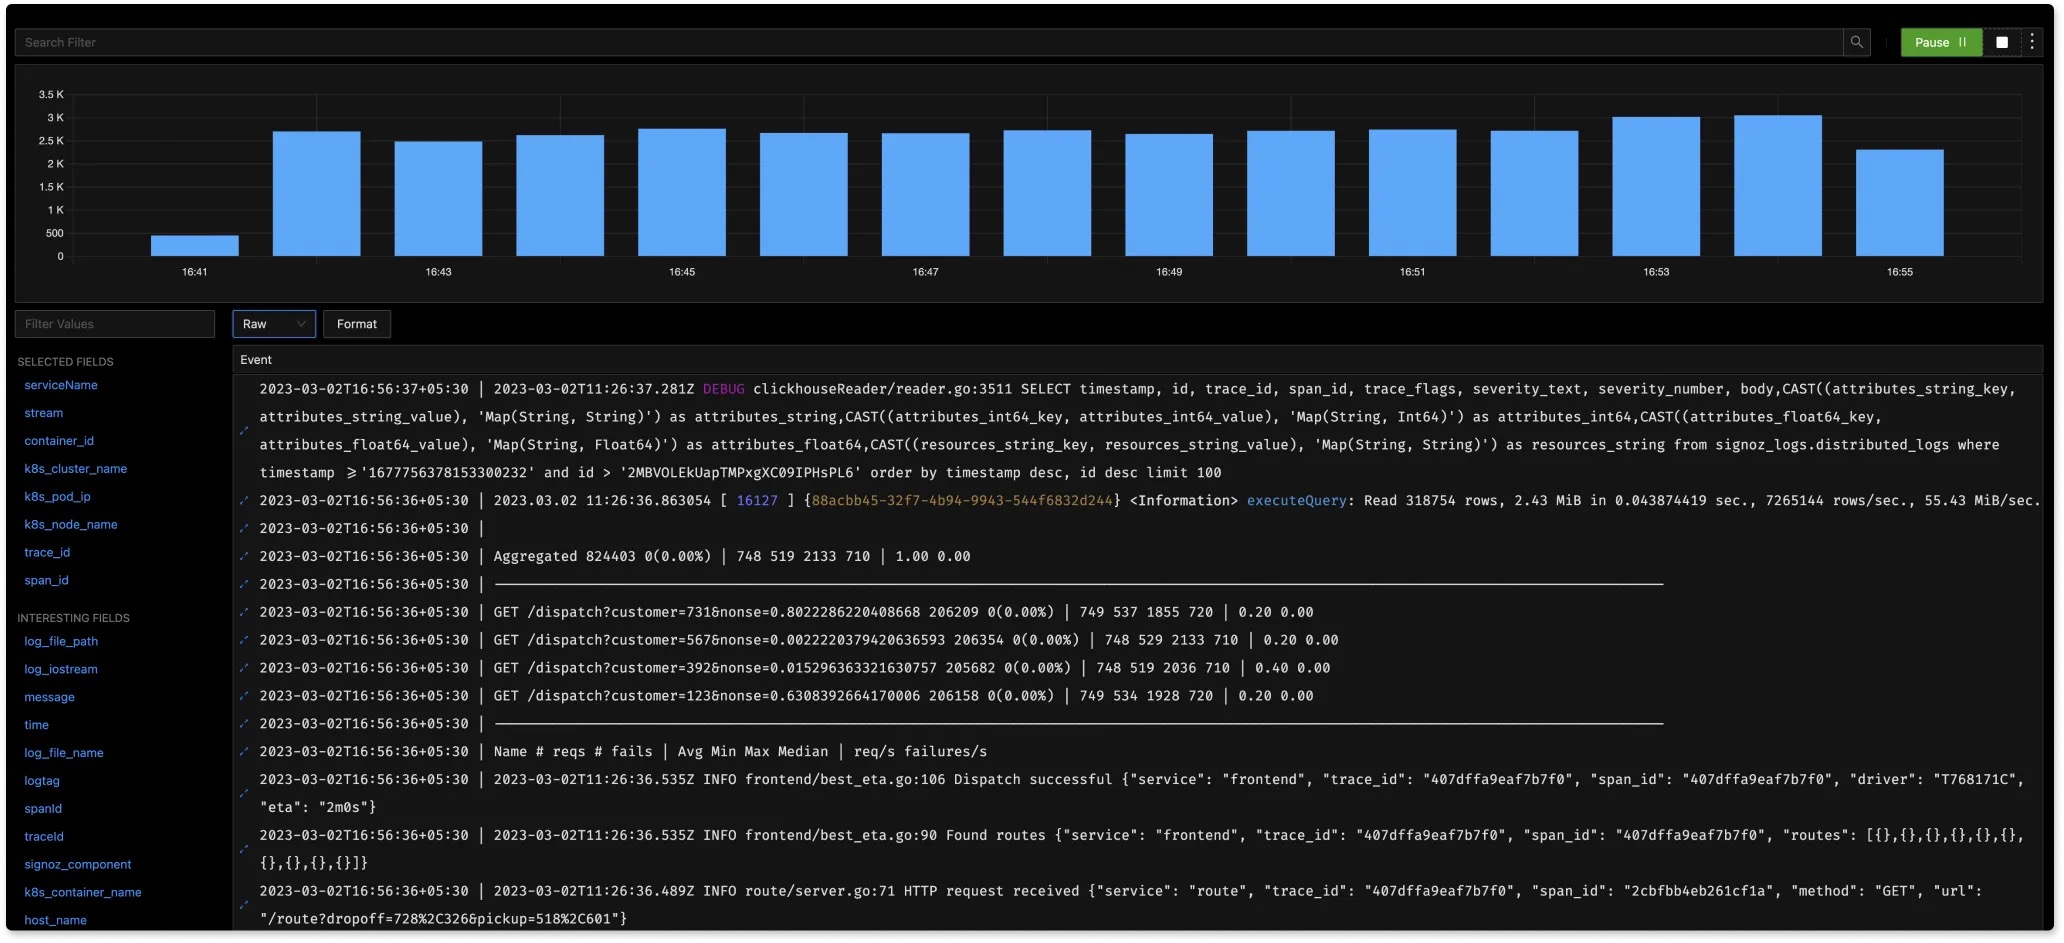
So Elasticsearch has good support for some small and medium clusters and full-text search, but for super large clusters and analysis-oriented scenarios, using column-oriented databases like ClickHouse might be a better choice. Log immutability perfectly suits ClickHouse's storage and analysis capabilities. Combined with ClickHouse compression codecs, storage requirements can be significantly reduced, and its linear scalability can easily scale clusters. For more about using ClickHouse for log storage, see this article: Log analytics using ClickHouse. Commercial open source company Signoz also uses ClickHouse as its OpenTelemetry implementation solution. The following image shows Signoz's real-time log analysis scenario.
Summary
Reviewing the entire article, we mainly covered best practices for printing logs, challenges in log management, and solutions to address these challenges. As one of the most important observation methods for system services, the importance of logs is self-evident. In today's increasingly complex systems, developers and ops personnel should follow good logging practices to address log management challenges.
Due to my limited abilities, if there are any errors or one-sided views in the above content, please point them out directly. If there are areas for supplementation, please feel free to comment or contribute to the repository. Thank you very much!
References
- https://blog.cloudflare.com/log-analytics-using-clickhouse/
- https://www.cortex.io/post/best-practices-for-logging-microservices
- https://stripe.com/blog/canonical-log-lines
- https://messagetemplates.org/
- https://www.dataset.com/blog/the-10-commandments-of-logging/
- https://brandur.org/canonical-log-lines
- https://dev.splunk.com/enterprise/docs/developapps/addsupport/logging/loggingbestpractices/
- https://opentelemetry.io/docs/reference/specification/logs/#log-correlation
- https://signoz.io/blog/opentelemetry-logs/
- https://izsk.me/2021/10/31/OpenTelemetry-Trace/
- https://sematext.com/guides/kubernetes-logging/
- https://www.datadoghq.com/product/log-management/
- https://www.dynatrace.com/monitoring/platform/log-management-analytics/
- https://tech.meituan.com/2017/02/17/change-log-level.html
- http://icyfenix.cn/distribution/observability/logging.html